COVID-19: some observations and queries following the publication of the Imperial College Response Team's paper of 16 March 2020
by Patrick Lee on 19 Mar 2020 in categories actuarial with tags COVID19 maths(Like all my posts on this blog, these are my personal observations, made in a personal capacity and not representative of any employer or organisation I am associated with.)
The UK government has stated that they are taking decisions based on scientific and medical advice. In particular, recent decisions have taken into account the paper published by the Imperial College Covid-19 Response Team on 16 March 2020 (see https://www.imperial.ac.uk/media/imperial-college/medicine/sph/ide/gida-fellowships/Imperial-College-COVID19-NPI-modelling-16-03-2020.pdf).
The publication of that paper is a very welcome and considerable improvement in transparency which in my opinion is a very important part in:
- The UK public (and people and governments of other countries since this is a global pandemic) maintaining confidence in the government's response to the Covid-19 crisis.
- Equally importantly, enabling a truly scientific approach to work: without being exposed to scrutiny and criticism by as wide an audience as possible, flaws in the decision process are far less likely to be found.
(We are not at war with an intelligent enemy intent on reacting to our strategy, hence there should be no need for secrecy. If any secrecy were to be involved, then the approach taken would no longer be scientific.)
I have now had time to read through the paper a couple of times and make some observations here and pose a few questions that jumped out at me.
(Note that the paper also contains modelling projections and similar conclusions for the USA, but here I focus on the implications for the UK).
Caveats
I am not trained in medicine or epidemiology. My qualifications are in mathematics (a degree), statistics (a diploma in mathematical statistics), actuarial science(I am a Fellow of the Institute of Actuaries), and I also hold Microsoft Professional Program certificates in Data Science, Big Data and Artificial Intelligence.
In any case, a true scientific approach means that anyone, no matter how qualified or unqualified they are, whether adult or child (or in an AI world, a robot or program!) is free to challenge any assertion, no matter how eminent the group that makes that assertion is.The scientific community and everyone else can then see whether the response to a challenge appears sound or not. If not, then the assertion must be corrected, refined, or dismissed.
You are completely free therefore to discount or listen to what I say as you wish. But I hope this post will be of some interest to those with an interest in trying to understand what (to me, as someone new to the paper, and from my interpretation of it) may be driving current government thinking.
Key observations so far from the paper
The most important points that I take from the paper are:
Assumed death rate
- The model assumes an average death rate of 0.9% for those infected in the UK by Covid-19 (Infection Fatality Rate, see page 5 of the paper). It is an average rate, so will be lower for some (e.g. younger people) and higher for others (e.g. older people or those with significant existing medical conditions)
- It assumes that on average 4.4% of infected people will need hospitalisation, and of these 30% (so 1.32% of infected persons) will require critical care. It assumes that on average about half of the latter will die, despite receiving ICU (Intensive Care Unit) treatment. (Again see page 5). Note that this also means that 3.08% of infected persons are assumed to need non critical hospital care.
- This isn't stated in the paper (perhaps it should be?), but if we make the assumption that deaths only occur from those who require hospitalisation (which I think should be correct to first order), in order to arrive at the overall death rate of 0.9%, given that we know that half of the 1.32% critical care cases are assumed to die (so 0.66%), it follows that 0.9 - 0.66 = 0.24% out of the 3.08% of non critical care hospitalisations (so about 1 in 13) are assumed to die. The converse is that treatment of critical cases saves 0.66% of those infected, and treatment of non critical cases saves 3.08 - 0.24 = 2.84% of infected cases.
- An important question is what would happen to new infected cases if the NHS was overwhelmed and unable to treat any further COVID-19 patients. From the above, the death rate would go up from 0.9% by 0.66 (from critical cases no longer being able to be saved) + (some but not all of 2.84 non critical cases no longer able to be saved). So the death rate would rise from 0.9% to somewhere between 1.56% and 4.4% of infected cases, depending on how many non critical cases can survive without hospitalisation.
On this basis, the death rate of new infected persons is likely to almost double, and perhaps rise almost five fold if the NHS capacity is breached.
Without intervention, the paper predicts peak infections in about 3 months time (so around mid June) and gives a projected 510,000 deaths.
Given the UK population of about 66 million, that would imply a death rate of 510,000 / 66,000,000 = 0.77% assuming 100% of the population becomes infected, or 0.96% if (as mentioned elsewhere in the paper) only about 80% of the population becomes infected.
Both of these rates are much closer to the 0.9% average rate the paper assumes allowing for treatment, than the 1.56% to 4.4% range that would seem to apply if the NHS were to be overwhelmed.
In fact the paper says on page 7 (the bold emphasis is mine):
we would predict approximately 510,000 deaths in GB and 2.2 million in the US, not accounting for the potential negative effects of health systems being overwhelmed on mortality.
Given that the paper also states (lower down on page 7) that without intervention the NHS ICU bed capacity would be overwhelmed by the second week in April, the actual number of deaths would be projected (on the model's own assumptions after allowing for no NHS treatment being possible) to be between 884,000 and just under 2.5 million.
Hence do nothing is not an option
Understandably given the above (since even 510,000 deaths would represent a doubling of the typical yearly number of deaths - from old age, sickness, motor and other accidents etc - in the UK from a population of some 66 million), the modelling team and the government have concluded that doing nothing is not an option.
They therefore look at two broad types of strategies:
- mitigation, under which the epidemic is allowed to continue to spread, but at a lower rate and not amongst the most vulnerable (older people and those with significant existing medical conditions), and
- suppression, under which the goal is try and stop the virus spreading, until such time as a vaccine or effective treatment can be found.
Mitigation strategy
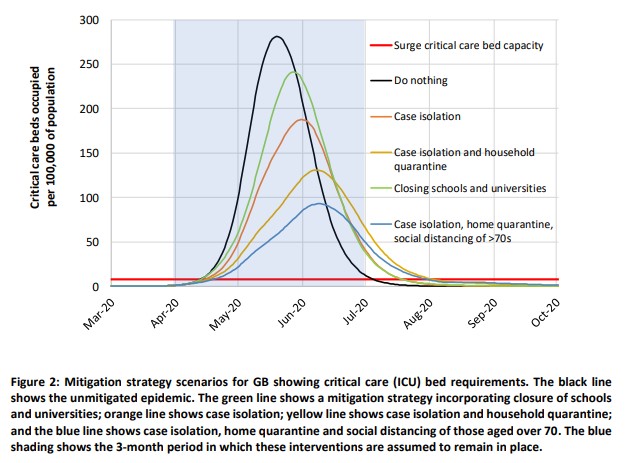
(The image above is from figure 2 on page 8 of the paper)
The paper states that under the model used, the best practical mitigation strategy that they have been able to suggest (see page 6) is a mixture of case isolation (infected persons or persons with symptoms self isolate for 7 days), home quarantine (for people in the same household as someone with symptoms, for 14 days) and social distancing for those aged over 70 (to protect them from becoming infected). This is the blue (lowest) curve in figure 2 on page 8 of the paper (see screenshot above). The red line is the NHS critical care bed capacity, above which further patients with critical needs can't be treated.
But even under that strategy, although it "reduces peak critical care demand by two-thirds and halves the number of deaths", it would still result in an 8-fold higher peak demand on critical care beds than the NHS has capacity for. Page 16 states (again the bold emphasis is mine):
even if all patients were able to be treated, we predict there would still be in the order of 250,000 deaths in GB.
Note that In the same way that the 510,000 deaths quoted under the "Do nothing" policy is a significant underestimate (because of the much higher mortality rate that applies once the NHS is overwhelmed), the figure of 250,000 also looks to be much lower than it would be in practice.
Not surprisingly, the group and the government have concluded that mitigation is no longer an option:
effectively all COVID-19 cases in figure 2 above the red line become subject to an assumed mortality rate of about 1.5% to 4.4% rather than 0.9%.
Hence the move since the publication of the paper to a suppression strategy (see page 16):
We therefore conclude that epidemic suppression is the only viable strategy at the current time.
Suppression strategy
Here the goal is to keep the number of infections below the level at which the NHS is overwhelmed. This wasn't possible with mitigation, so the strategy is to stop the infection spreading by severely reducing social contact.
However, the social and economic costs of doing this are considerable (so this is not sustainable beyond a few months), and given that Covid-19 is a global pandemic, the epidemic is very likely to flare up again very soon after restrictions on social contact are released.
This strategy therefore involves a succession of alternate periods of isolation for the population as a whole, followed by temporary relaxations, with such iterations continuing until either a vaccine has been found, or an effective treatment, or massively increased health service capacity.
The paper states that under the model used, the best practical suppression strategy that they have been able to suggest (see page 11) is:
Combining all four interventions (social distancing of the entire population, case isolation, household quarantine and school and university closure) is predicted to have the largest impact, short of a complete lockdown which additionally prevents people going to work.
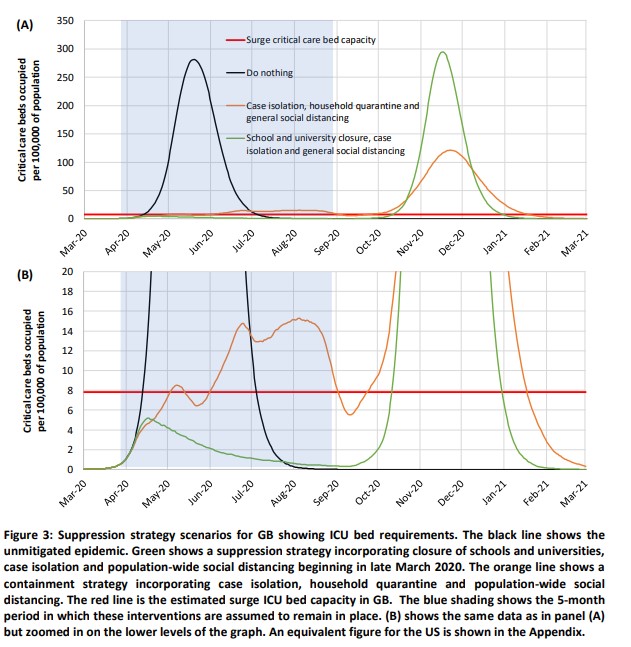
(The screenshot above is from figure 3 on page 10 of the paper.)
The strategy proposed by the group (and it seems adopted for the time being by the government) is shown as the green line.
Note that it assumes that the current restrictive measures remain in place for about 5 months, and are likely to prevent the disaster scenario of the NHS capacity being overwhelmed, thus keeping the mortality rate at the assumed lower level of 0.9%.
It then assumes that some of the restrictions are temporarily relaxed in about September of this year (with schools and universities reopening and social distancing relaxed), before being reimposed again after what looks like 3 to 4 weeks (before the green line starts rising steeply towards the NHS capacity red line.
We face 12 to 24 months of facing very significant social restrictions for about 2/3 of the time
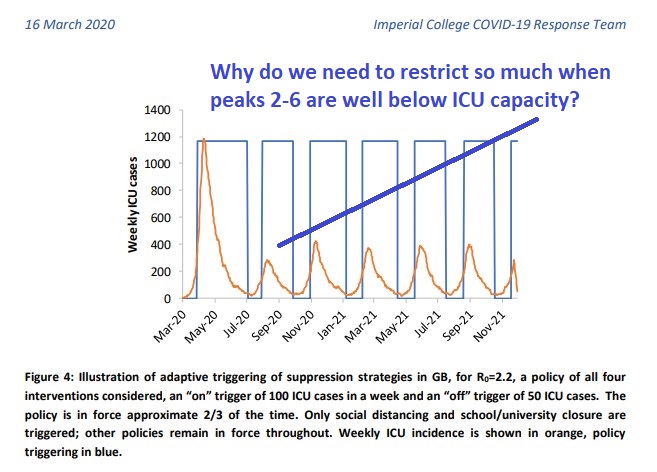
This approach is shown in the screenshot below of figure 4 from page 12 of the paper:
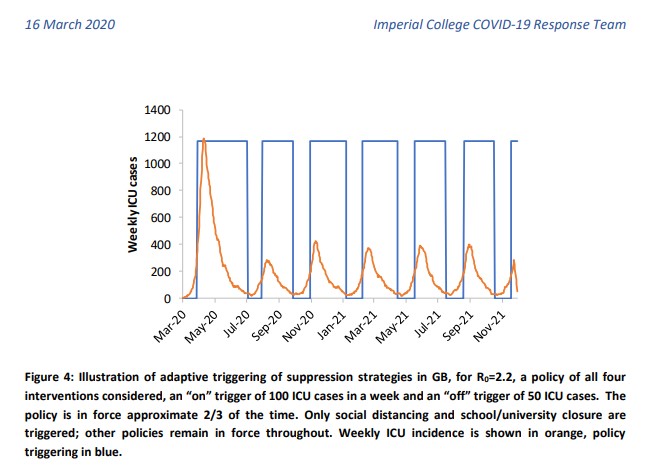
What this chart implies is that, until either:
- an effective vaccine is found, and sufficient stocks of it become available, or
- health service capacity is very significantly increased, or
- an effective method of home treatment (not requiring skilled medical equipment or staff) is found, or
- a suitable combination of the above
we in the UK (and probably those in other countries too) face many months (not just the next 5, but probably a year or two) of alternating restrictions and partial relaxations (with social distancing relaxed, and schools/universities reopening), with full restrictions operating an estimated 2/3 of the time.
The changes to our way of life (and to our economy) are likely to be profound. But the alternative looks very stark: infected patients facing average death rates of somewhere between 1.5% to 4.4% (the 0.9% that we face even if the health service capacity were a thousand fold bigger is bad enough) and doctors and nurses facing agonising decisions as to who to treat.
Some (possibly significant) queries
The above are the conclusions that I draw from reading the paper. I may be mistaken, and in any case corrections or comments are welcome.
I do have some queries. Some are very minor so if I post them at all it will be in a follow up post.
But two queries might have a significant impact on the severity of the regime that it looks we (the human population) face from the group's analysis (for which I believe they are owed many thanks given the considerable work involved, and its importance):
Can the restrictions be relaxed more often than just a 1/3 of the time?
In figure 4, the peaks are projected to be much lower after the first one. ICU (Intensive Care Unit) surge capacity is stated (page 13 of the report) to be approximately 5,000 beds.
Couldn't we switch to a higher trigger level for reimposing restrictions (such that the peaks are around 1,000 or even 2,000 ICU beds rather than the 400 shown in figure 4)?
This would demand a lower proportion of time in suppression mode than the 2/3 projected in figure 4.
To what extent might the assumed mortality rate be significantly overstated due to not counting infected cases with little or no symptoms?
.One of the paper's key assumptions is the Infection Fatality Rate (the death rate for infected patients) of 0.9%. That is stated (on page 5) to have been arrived at from an analysis of known deaths out of total known cases in China, and adjusted for the UK's age distribution.
But the UK's Chief Medical Officer has stated that the government's best estimate of the true current number of cases (including patients who are unaware that they have COVID-19, because they haven't been tested) is around 40,000 to 50,000, as compared with the most recent number of confirmed cases so far (2,626 as at 0900 on 18 March 2020).
Of course it is not clear whether "40 to 50 thousand" means currently active cases, or the total number infected so far, which would be comparable with the 2626 known cases.
But it does seem possible that if we (or the Chinese) could test everyone, we might find that the number of current cases is actually 10 times higher than the current number of confirmed cases. In which case the correct average mortality rate to assume might not be 0.9% but 0.09%.
Because of exponential growth in the number of infections, NHS capacity would still be breached without suppression, but instead of the post breach death rates being somewhere between 1.5% and 4.4%, they would be between 0.15% and 0.44%, leading to extra deaths compared to a normal year of the order of 100,000 to 290,000 - still bad, but better than the current 600,000 we face the prospect of, even under the suppression policy (given that the government has said that most of us are likely to be infected at some point), on the assumption of a death rate of 0.9%.