When is Covid-19 going to peak in the UK? Some analysis from David Wilkie's v3 model
by Patrick Lee on 03 Apr 2020 in categories actuarial with tags COVID19There is no perfect model, and it seems clear that there is still a lot of uncertainty in many areas, including about how long the Covid-19 virus is infectious for, and how long carriers can be both asymptomatic and contagious. The UK government seem to be expecting the current epidemic to peak within a couple of weeks (i.e. in mid April). Version 3 of David Wilkie's model has been fitted to try and represent the UK situation as at 20 March 2020, and includes various scenarios for how effective the social distancing imposed from about 21 March might be in reducing how much the disease spreads.
See the section entitled "Update 1 April 2020" on this page of David's website. On that page, David produces full details of his model, including documentation and calculations in Excel.
The model projects the following peak dates (taken as those when the number of deaths is at its maximum), and eventual total number of deaths, under 9 different scenarios:
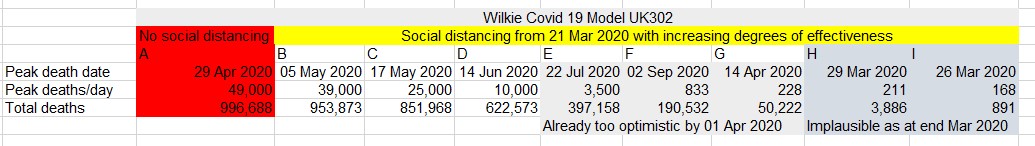
(Please note that these are just from the current outbreak, so ignoring possible further outbreaks later this year or next year. They also ignore any possible overrun on the UK's National Health Service).
Scenario A is for illustration on the assumption that the mitigation policy in place before 21 March had remained in place. We know that the Imperial College Covid-19 Response Team's equivalent projection is about 510,000 deaths, so the two models are at odds here. We have to hope that the Imperial College model is more correct, but it seems to me that the challenge that David's model poses at the moment is: it seems coherent, so if it is wrong, in which areas? I have not seen the Imperial College model. Of course, with an epidemic where the number of cases seems to be doubling roughly every 4 days, it may be very easy to over or under-estimate the likely total number of cases by 2 or more, particularly when the true number of cases is unknown.
Scenarios H and I are the most optimistic ones as to the effectiveness of the UK's social distancing policy.
In scenario I, it is assumed (for the sake of showing one extreme) that the virus is immediately unable to spread further and dies out within 2 weeks, as all persons currently infected either recover or die. New cases are still detected for the first 5 days in line with the default parameters in this version (3) of David's model under which it is assumed that it takes 5 days for symptoms to appear.
In scenario H, the virus spreads very slowly, and dies out by about mid June.
However, both of these scenarios already look extremely optimistic because the actual numbers of confirmed cases and deaths have already significantly exceeded their projections by the end of March.
Similarly the numbers of cases and deaths projected under scenarios E to G look implausible in comparison to the actual published numbers by 1 April.
But maybe we are in scenarios somewhere between A and E?
More importantly, what is it about the modelling that the UK government is relying on that is leading them to predict a peak of new cases (and probably daily deaths) many weeks earlier than the projections in David's model?
As David says, his model or calculations may well be wrong (and indeed he hopes it is wrong with regard to the high number of deaths projected, and would be delighted if someone can point out a mistake, or implausible assumption!).
I hope we (the collective human mind, pooling all our skills and experience together) ought to be able to examine the model relied on by the UK government in the same way: with exponential growth, two weeks can make the number of cases grow more than ten fold.
I understand that the source code may be being made available very soon by Professor Neil Ferguson.