Valuing large pension plans more quickly and cost effectively using Azure Functions (Part 1)
by Patrick Lee on 29 Apr 2019 in categories actuarial BigData pensions tech with tags Azure AzureFunctions AzureQueues cashflow projection ExcelPowerPivot PowerBI SQLAzure valuationI love the idea behind "serverless" computing, including Azure Functions which is perhaps Microsoft's main offering in this area. Of course it is not really serverless, because servers (virtual machines) are still being used in the background, but without you having to manage them: Microsoft do all that for you behind the scenes.
The particular problem that I have been using Azure Functions to address is an #actuarial #BigData #pensions one:
how to perform a financial valuation of large numbers (100,000 or even several million) of UK defined benefit pension plan members via cashflow projections as quickly as possible, but without incurring unnecessary cost .
When done accurately and before any clever processing, the number of cashflows produced can easily run into the millions, and for a large pension plan, into the billions. (When I have time, I plan to explain why, and talk about some of the clever processing that can be done).
This situation is one that obviously calls for parallel or distributed processing, with the work shared out between many machines.
The traditional (non serverless) way is to simply spin up as many machines as you like (e.g. I have done this with more than 150 cores), split the work amongst them and keep reallocating any remaining work amongst the machines until all the work has been done. That can be done using Microsoft technology using #AzureBatch. But it is also the most expensive way to do things, because all the machines are dedicated to your work until it is all completed. So naturally you pay for the number of cores times the time taken.
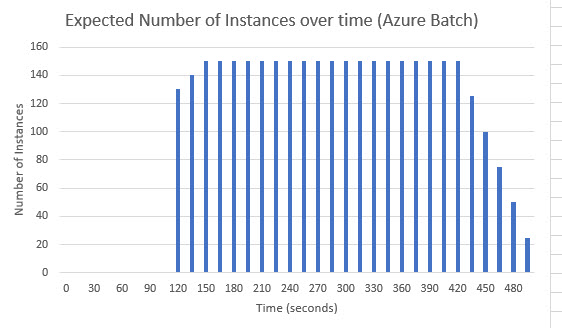
So, given that it takes some time for the machines to be ready for work, this is the pattern to be expected Azure Batch (caveat: I am extrapolating from my experience over larger workloads taking closer to 2 hours than here about 7 to 8 minutes, so have made a note to test Azure Batch over this smaller period):
It takes a couple of minutes for the instances to all become ready for use (but since they all started being warmed up from cold at the same time, there is little variation in the time to warm for them), then the machines are all fully occupied as the work gets allocated evenly to them, then (probably because of a little random variation in the speed each machine takes - perhaps dependent on relative health, e.g. out of 150 some may perform slightly worse than others) the bulk of the work gets done with a few stragglers taking slightly longer.
The serverless way is to use something like Azure functions, in which case one way of doing things (the way that I have used) is to split the work into small chunks and send lots of messages to an Azure queue, each one containing the instructions for a particular chunk of work.
In theory what should then happen is that Microsoft Azure will realise that the queue is getting lots of messages, and start spinning up an increasing number of machines ("instances") to do the work, and keep doing this until all the messages in the queue have been dealt with.
Of course, there is no guarantee that Azure will keep increasing the number of instances until the work is done. Instead, as I understand it, Azure uses an algorithm to determine how many instances are needed, and after increasing the instances for a while, may actually start decreasing them if the algorithm deems that the queue is going down satisfactorily enough. (I have not been able to find out how the algorithm works, but it is said to take into account not only the rate of increase/or decrease of messages in the queue, but also the age of the oldest message in it. This is further complicated by the fact that some messages - for reasons that are hard to find out - seem to fail to be processed at first, and are then hidden from the queue for several minutes, before becoming visible again in which case they might be processed. As I will demonstrate, while this only seems to affect a small percentage of messages, it can delay the time until all the work is complete quite significantly.
I have recently carried out some 91 different timed runs using Azure Functions under a variety of circumstances, e.g. in some I used Azure functions version 1, in some version 2. I also varied the number of queues (sometimes allocating all the work to 1 queue, sometimes to 2 queues, so that 2 different functions are performing the work, and in some to 5 queues. In some of the runs with 2 or 5 queues I applied a form of load balancing (by moving messages from the slowest queues to the fastest ones), in others I did not.
I also repeated the same run over and over again, in order to test how repeatable runs using Azure functions are.
I found that the answer (both in terms of the number of instances doing the work, and in terms of the total time taken to complete the work) sometimes varies quite a lot.
In all my runs, the task was the same: for each of 1000 queue messages, the Azure function processing it had to wait for 65 seconds and then it could return and report successful completion.
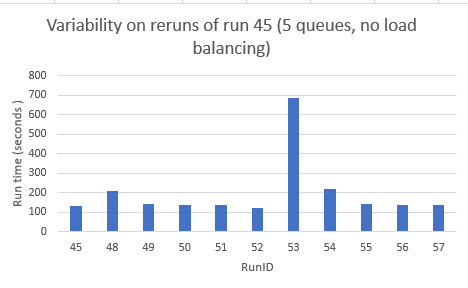
Here is an example of a situation when there was a reasonable degree of repeatability in terms of total time taken (although not in terms of how many instances performed the work): my runs 48 to 57 were a deliberate repeat of run 45, in which the work was allocated to 5 different queues, so equally to 5 different Azure version 2 functions, each with 200 messages to process.
Out of 11 runs (including run 45), the total time taken was pretty close across 10 of the runs, apart from one (run 53), where the work took considerably longer to complete:
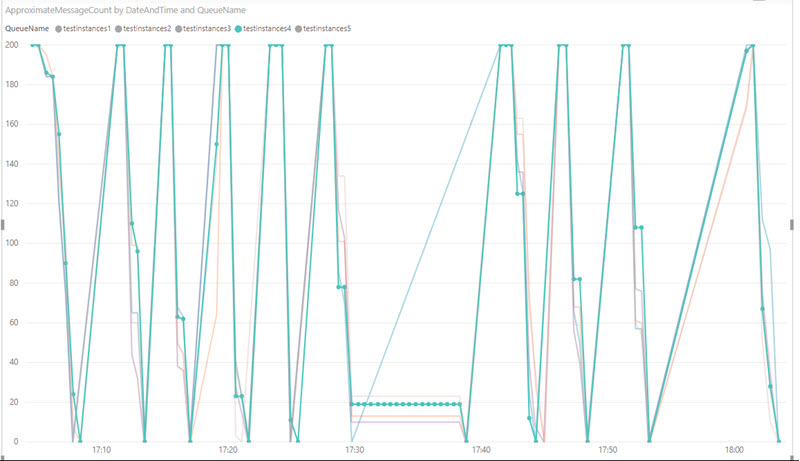
NB the technologies I used in these runs were Azure Queues, Azure Functions, Power BI, SQLServer (on completion of processing a message, each function logged its start time and end time and the identifier of the message to a separate queue, and a different type of azure function then saved that to a SQL Azure database, which was then processed by a web app to produce the type of chart above. In addition, I used Power BI to check the approximate number of messages in each queue to monitor how quickly each queue was being dealt with.
More on this (and what exactly was happening in run 53?) in Part 2, which I hope to write in a few weeks time.

