Web version of David Wilkie's Covid-19 model v 2.1
by Patrick Lee on 30 Mar 2020 in categories actuarial tech with tags COVID19 javascript TelerikFor those who are not comfortable with downloading and manipulating Excel files, I have written a web version of version 2.1 of David Wilkie's model (the slightly earlier version than the 2.2 version published yesterday) for #Covid19.
Click here to use the web model. (NB It looks as if you might need to accept cookies on the site for the model to work.) It is not as flexible as the Excel files in that you can't change formulae (only the parameter values), but it is quick to use and to see charts of infections and deaths each day, and their cumulative totals over time.
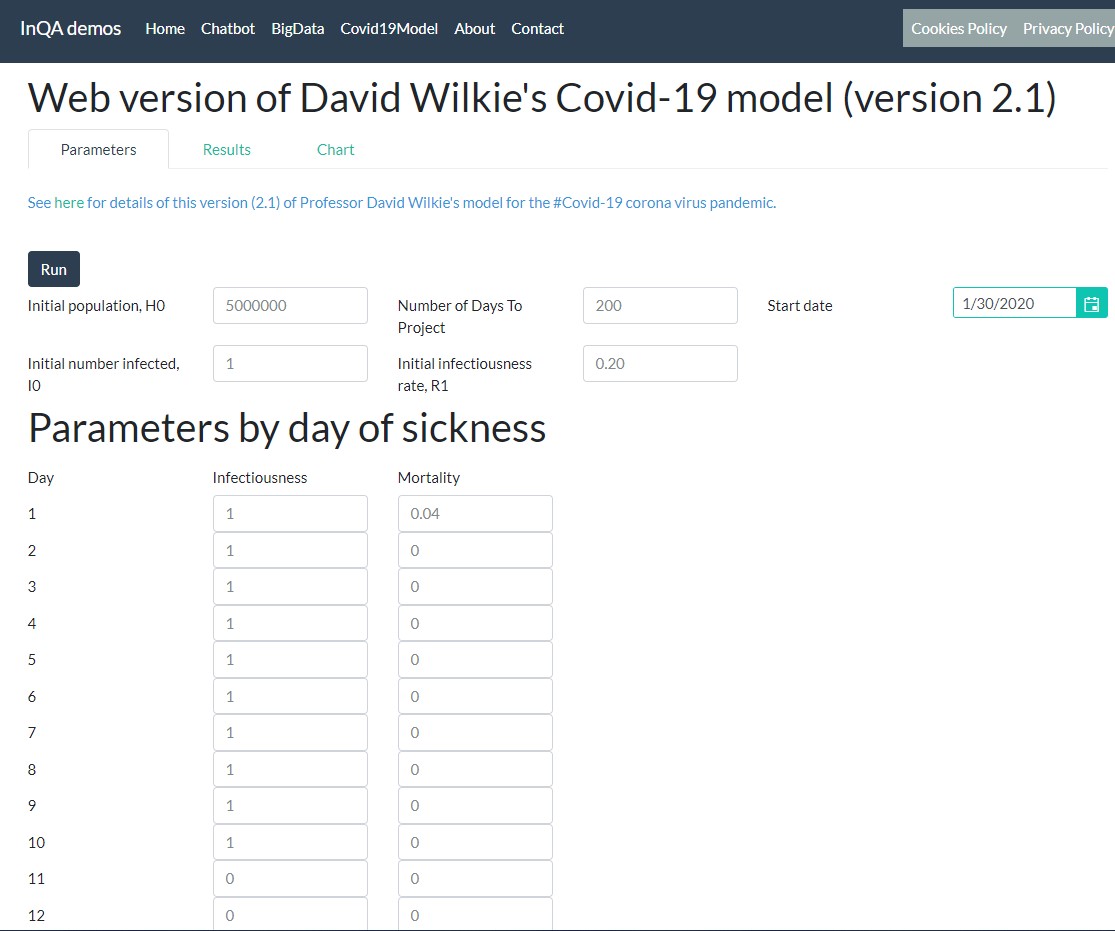
Setting the Parameters
The screenshot below shows the default parameters:
After clicking the Run button you can look at the Chart and Result tabs:
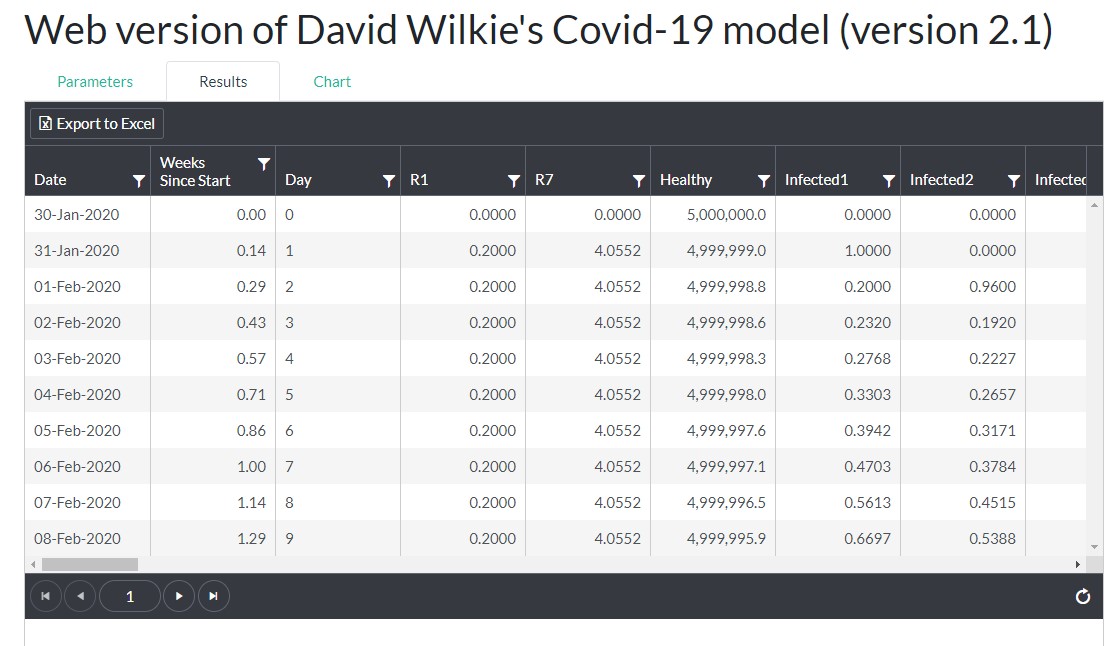
Chart tab: showing and hiding different series
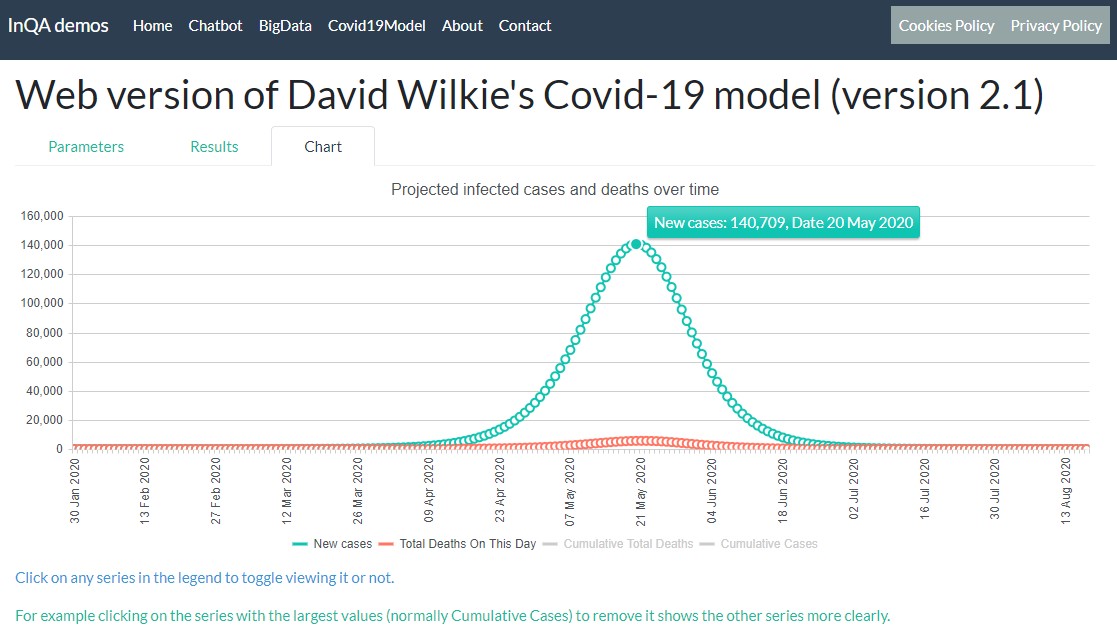
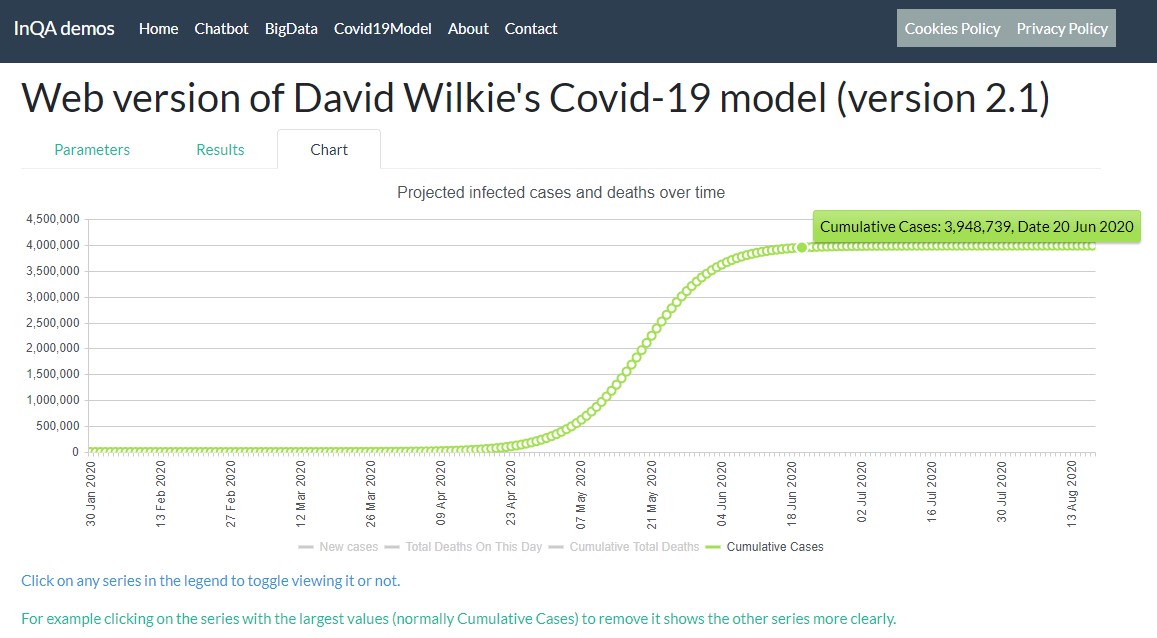
By clicking on the name of a series in the legend, you can toggle between showing that series or not showing it. In this way you can look in detail at each of the series, even though they have different orders of magnitude:
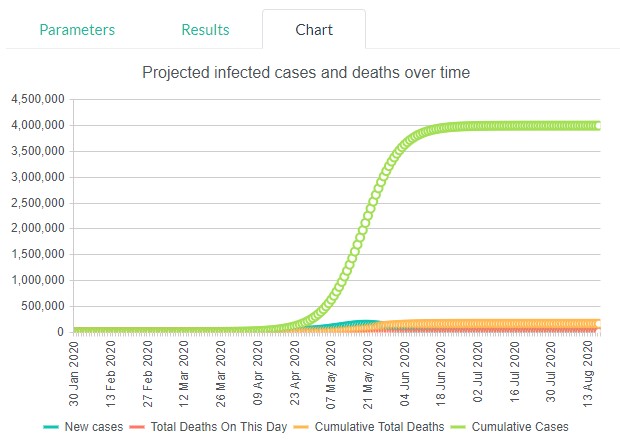
Under the default parameters (which do not reflect social distancing) the eventual number of cases gets very high by mid June:
After clicking the Cumulative Cases and Cumulative Total Deaths series in the legend, the next screenshot shows the peaks in cases (and deaths) are projected to occur in late May in the absence of social distancing: